Between the Gaps $ES_F $SPY $SPX $$

The rally scenario, turned out to work out. The SPX closed up almost 3% @1192.55.

Currently, the index is contained betwwen 2 10 point gaps, as noted below. 

Bbb

The SPX futures, managed to surpass and mantain Sunday opening print which currently (8:50PM, ET) is holding. My impression is that the expectation out there is that this might be the time for the Xmas rally to come. 

2011-11-29_0109

Although I´m still keeping the bias of the possibility of an end of the year rally, there a few points today. Low volume day: Almost 20% below the 3-month average. It is also important o note that the rally was NOT supported by the initiation of long positions. Asposted in the chart below, the previous level of long inventory was taken back last Friday. Although to this point it doesn´t matter for my analysis, I have left it on purpose in order to illustrate the low levels of new positions.

I´m working here with 2 diferent scenarios:

a-) The last level of long inventory gets respected during tomorrow/the next few days and the high levels of short inventory above start to cover their positions, thus creating a short cover rally. How long will that last, it is impossible to tell.

b-) Aternatively, the new longs that initiated their positions last Sunday cannot hold, the level gets taken out and the ES will probably fill the gap and possibly make new lows.

2011-11-28_2339_001


Levelwise

* 1169.75-1172 mayor support

* 1181-1183 as support (weaker one)

* 1201.75-1199 (resistance)

* 1207 – 1209 (second resitance)

2011-11-29_0026


What??s next? $SPY $SPX $ES_F

I have been absent the last 2 days of the past week. Lack of liquidity could create disastrous consequences in Pre-Holiday enviroment. 

As I´m wiriting this post, the S&P500 futures are still 20 pts. above Friday´s close. We´ll see in the foollowing hours if that gap gets filled

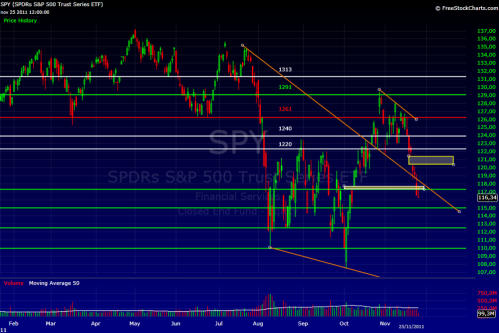
Looking at a traditional view of the SPY, we could say that along the levels I´ve been using as guidelines the index is pretty much in the middle of nowhere: just below 117,60 and above 115,20 which is another important area of support. Those would be some of the key levels I´m going to be considering moving forward. 

Ssss

Last week I talked about what I called the last man standing.

The last man standing  -initiated @1066, back on October the 4th- is the only one left. Due to the size of the charts, I am posting two images: one from early October -when those longs were initiated- and one of the current situation, so the realtionship between prices/inventory levels can be appreciatted. Now it is up to the last man standing, to keep support. So far (at 7:30PM, ET) it seems to be holding. Therefore, provided it holds during Asia and London sessions, we could see further upside

As noted on the chart below, the last level of committed longs has been tested and gave up last Friday (the level is marked in white), which was reflected in the 12 point selloff during the early Friday morning. Although the index recovered some of its previous levels, he rally lost momentum, closing off 20 points from 1171.25 highs. This has left a heavy shorted market that could provide some fuel for a rally if new buyers come into the market. This is not a predicition, just a scenario. 

Wwww2011-11-28_0154

Levelwise, see below for some important areas I´ll be watching in the closer term.

2011-11-28_01472011-11-28_0141

Update & Some Ideas $SPY $SPX $ES_F #market #ferrari $$

This is how the market feels today. It seems everyone was ready for a Thanksgiving rally, which, not only never really materialized, but ended up in the worst form.

Car_crash_ferrari_458_italia_tree_hugging_in_maranello

I Wanted to post yesterday, but for some reason I had no access to posterous. My open apologies if you were following. I´ll try to post as soon as I can. Drafting my ideas into this blog, is slowly becoming easier.

Important levels have been breached. Those posted back in Late July and early August are still in valid.

The levels noted below have provided guidance in my trading and analysis. So far, they are still in force. 

Xxxxcv

As it follows

Some were the levels I´m watching.

1313 – above, SPX could possibly resume the rally

1291 – first mayor test area

1261 – bull market in danger

1240 – a sustained move, could propel into bear market 

In fact, there was a small gap dating from early october 117.40-117.73 aprox., which was filled today – Below that, I see 115.20 as a critical level. Above, the SPY would need to fill the gap to regain some traction to the upside.

This how the picture is looking now (6:10PM, ET)

2011-11-23_2003

I attribute most of today´s weakness to EUR/USD performance, linked to a poor bond auction in Germany and overnight weakness inginited by HSBC China PMI. 

On regards to the levels in play, please see the chart below to have a broad idea of what I´ll be watching during the following days.

2011-11-23_2014

To the upside, the first mayor level will be 1180 on the ES. If the market clears that level, we could possibly see more upside, even to 1195, which is almost a confluence zone with the daily chart, posted at the top of the article.

Below, I`ll be watching 1150 and 1140 as important levels. What sorts of concerns me, is the vertical development we had during the last 5 minutes of the cash session, plus the fact that important levels of long inventory that have been breached, which I´ll get into below.

Important to note, the area between 1161 and 1165.50 on the ES is very thin. I do think if the market can regain some upside above 1162, then that could eventually open the door for more upside in the shorter term.

Another matter I want to point out is the 1167.50 level, which referes to a previous POC (point of control). Although some might argue that this leveles has been “breached” several times over the last few sessions, it is important for me to point them out.

I have found out that they have worked for me in the past as important guidelines. See the close up below, and the origins of the POC, back in early October. At last, I have added a longer term view of the whole set of levels in the range.

Vpoc

As for current long/short positions, I pointed out back on Sunday, that they were important levels of long inventory beign held below the current price:

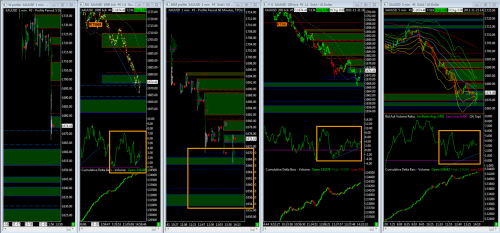
This week I´m even more cautios, mainly due to the reason that we are facing “critical” levels of long commitment in terms of positions held. You´ll see in the chart below, that the Cumulative Delta is showing several levels of commitment in terms of long positions. For example, currently we can see that the down move is testing the commitment of those longs initated at 1165 aprox. on or near late September/early October. If that happens, we could see further upside, geared towards the green line, which are the long positions intiated in early september around the 1150 level. That level is followed closely by those long positons initiated at the 1145 levele, aprox. Thus, if some more sustained downwards/selling pressure comes into the market, the risk of downside is increasing. 

Point to be made is that, during the last three days, the commitment of those beign long in the market has been literally erased. They bailed out of their long positions during the selloff, as you may note from the chart below. 

2011-11-23_20532011-11-23_2049

The last man standing  -initiated @1066, back on October the 4th- is the only one left. Due to the size of the charts, I am posting two images: one from early October -when those longs were initiated- and one of the current situation, so the realtionship between prices/inventory levels can be appreciatted. Now it is up to the last man standing, to keep support. So far (at 7:30PM, ET) it seems to be holding. Therefore, provided it holds during Asia and London sessions, we could see further upside

I´ll try to update the levels in the morning.

And there we go $ES_F $SPY $SPX #market

– Trendline support (barely broken during monday´s afternoon)

Spxxx

– Now we have a gap to fill.

Gap

 – As for inventory levels on the ES

Inventory

  • Those long positions entered @1165 aprox. in ealry October, have been taken out [3]
  • Next level of inventory in the near term: longs that have initiated their positions @1050, during the first days of October (the 4th to be exact) – This is a key level [2]
  • The first big test for the -eventual- upward move to taken momentum is to breach the inventory level initiated on Sunday night@1210. [1]
  • 1145-1150 long inventory has been taken out [3]
  • 1105 longs are the next eventual vulnerable position, in the event downward momentum continues to develop.

– Levels [BLUE –> areas of support // RED –> areas of resistance]

Ltpo

** it is important to note, that the levels in the chart above are established presently (11:30PM, ET) and are subject to be breached during Asia & London sessions, as the market moves in either direction, thus creating new levels. The closer ones to the price, bear the highest probability of beign breached. Therefore, do not assume that they would be in force during tomorrow´s NY session. Ill try to post the new levels during the open or during the day in order to show the newst areas @created@ during Asia & London **

Gold: another Wiley E. Coyote moment $GLD $GC_F

Wile_e_coyote_gravity

Gold has been following the behaviour of the general market, which points out another decoupling from a previous correlation (negative, in this case to the S&P500) during similar circumnstances. It finished the week -3.6%. Similary, the S&P500 finished the week 3.7% in the red.

The metal currently sits at an important level of support, followed by 1698-1708, and finally 1682-1692. If the latter is breached, most likely 1655-1660 might be in play, since the level of 1680-1655 is a thin area, which are ususally “revisited” in a following cycle.

Above, 1728-1736 should be noted, followed by 1743-1751, which, if breached, might take it to revisit the 1758-1768 level

2011-11-21_0214

As shown below, positive divergence in orderflow in relation to price suggests upside might be in the cards in the future, if  the 1710-1700 level is respected.

2011-11-21_0218

To be, or not to be. That is the question for the #Euro $EURUSD $6E_F

Whin316l

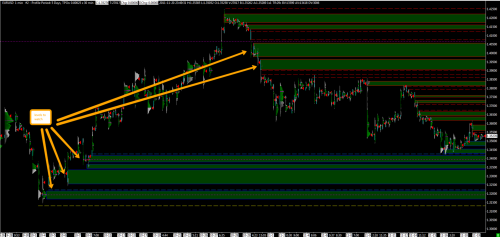
1.3420 support has faired quite well, considered it has been tested several times during the last week. The level has been accepted, at least for now. Feels like it is waiting for something. It is important to note also, that there has been a very high positive corraltion between the Euro and the S&P500 futrures, lately.

The Euro open on Sunday night with tiny 5 pip a gap down, which was almost instantly filled following the first 20 min. of the session. This has not happened with the ES, which is currently almost -10 points, at the time of writing (11:40PM, ET). This is defintely saying something.

2011-11-21_0136

Levelwise, the chart below is showing the areas of interest. Aside from the 1.3420-1.3400 level, It is important to point out the 1.3250-1.3330 as a key level, where the previous upmove back in early June took place, followed by 1.3170-1.3220.

To the upside, if the barrier of 1.3650 is breached, I think the Euro could possibly see 1.3800-1.3850, even 1.3950-1.400. Compared to previous crisis (2009, for example), the Euro has faired fairly well, considering the crisis is only getting worse. This makes me think, as a possibility, the alternative of some in the market have been already pricing in some sort of future event. Just an idea.

2011-11-21_0149

Playing Field $SPX $SPY $ES_F #market $$

The S&P500 lost more than 40 points during the week The marrket is still driven by “headline” risk deriving from Europe and everything points out to another volatile week. Spain celebrated elections today, and seems the conservatives have gained the elections.

So far, Euro still in range (at the time of writing, 10:30PM, ET) 1.3560-1.3500. The S&P500 futures have opened this Sunday with an 8 point gap down, which have not yet recovered.

Longer term, the candle closed and is almost resting in a flat lined 20EMA (monthly), following 3 weeks of radical chop. As noted during previous inflection points, the change in trend usually comes preceded by several months of indecision. Thus, the period of 2001-2002  took 2 months for the initial push down to become a trend. 2007-2008, 5 months, and 2010-2011, almost 12 -depending if you consider it one or two stages. 

However, since the chart is showing we are facing a possible inflection point in the S&P500 for the intermediate-longer term trend, I find it useful to review it, in order to get a brader view on regards to where are we currently sitting.

Spxlt

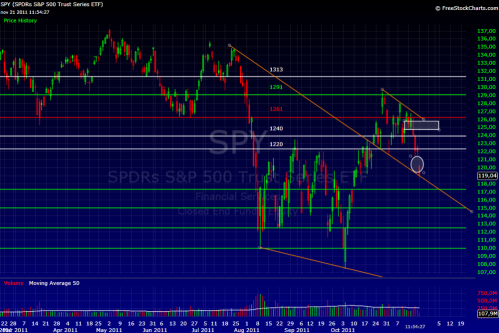
The daily view of the SPY shows last week declined. It closed aty 121.98, jus a tad below the 122 level – These are not arbitrary levels. They have been tested and have “contained” the move for almost a month. The area marked with the circle  -aprox. 120.80/119.20- seems to be in the cards. To the upside, 122 // 124 // 126.40 are my short term resistance areas.

Spxst

My short term view: tonight´s open (gap), has “cleared” some of the long positions entered back around Friday@noon, which so far (at the time of wirting) has been holding. The long positions entered tonite, will have to be respected and maintained if I want to see further strenght develop in the market, as pointed out in the chart below.

Loi

Levelwise, the chart below shows the areas of support and resiatance I´ll be watching. SUpport in BLUE. resitance in RED.

Sr

Last week, I pointed out that I was leaning towards a year´s-end rally. I´m still somewhat favoring that scenario, although I´m even more concerned about the possibility of it duew to the critical position that the longs are into at the moment. In the chart below, you can see how the (negative) divergence bewteen price and orderflow showed that the gain in price was not accompained by commitment towards long positions of market players. Thus, the cauntion on the long side, as originally posted. This week I´m even more cautios, mainly due to the reason that we are facing “critical” levels of long commitment in therms of positions held. You´ll see in the chart below, that the Cuulative Delta is showing several level of commitment in terms of long positions. For exmaple, currently we can see that the downmove is testing the commitments of those longs initated at 1165 aprox. on or near late Sept./early October. If that happens, we could see further upside, geared towards the green line, which are the long positions intiated in early september around the 1150 level. That level is followed closely by those long positons initiated at the 1145 levele, aprox. Thus, if some more sustained downwards/selling pressure comes into the market, the risk of downside is increasing. 

Alternatively, the near level for the the market to regain upside are the shorts positions initiated on Friday, around the 1230 level, which are at a reasonable distance. If that levele is breached but upward momentum, then I´ll be watching how the above leevels  (1235-1240-1260) of short commitment hold the upward pressure.

2011-11-21_0117