Almost a month has passed since my last post.
I was planing to take some time off, but decided to to push the dates forward. I took a break during the last week of December and traded lightly during January.
Personally, it has been a particulary challenging market to trade. Tight ranges, a clear uptrend (at least for now), dip-buying and little/no rotation have not provided as many opportunities as the previous months of 2011.
My feeling is that quite a few were expecting the market to correct after the first few days of 2012, which never really happened. Furthermore, the headlines were not particularly amicable, with all the eyes centered around the developments in Europe.
We are in the middle of Earnings Report season. So far 183, or 36.6% of the firms in the S&P 500 have reported -you can find an interesting take on earnings here.
My last complete analysis was written back in in December 14th, 2011. This, pretty much a few days before of the market reaching a bottom at the ascending trendline @119.95SPY or 1198 ES.-
My idea this year would to be a suscint as possible. However, it feels important to me to explain the reasons behind the possible scenarios I usually draft in my analysis. I have found out that my trading has benefited from the process.
Longer term, the last post from December 11th, 2011; the S&P500 was @1255. Following the timing model, the index was sitting above the 20EMA (monthly), which was up sloping. This suggested more upside to come. However, I was expecting some more chop before an eventual rally could develop, which was not the case, since we´ve been pretty much moving up since then, currently sitting some 60+ points above. So far, the trend is up. Currently, the S&P will have to take 1232 to give a sell/cash signal -given the chop that usually a change of trend entails, it is better to have a clear change of trend in the long term model.
A daily view of the SPY, shows the clear brake of the downward trendline from early August-late December 2011, and the subsequent rally we have witnessed since late December of 2011. Some might argue that an ascending wedge might be developing, which is usually accepted as typical chart pattern that tends to resolve in sharp correction. I have marked a possible support area between the 128.70-126.40 as first support area, in the event the up move starts showing signs of weakness. Important to note is the fact that the index is sitting approx.@1313, which is a key level I´ve been watching for quite some time (late July, 2011) and have worked quite well as guidelines. SPY is currently sitting at the “rally resumption level”, however it will not be in that mode until the current level is surpassed clearly. Still, I would not consider a change of trend, until the 1240 level is broken.
At last, It is important to note that there are quite a few unfilled gaps. Since most of the of the big market development of the last few months have been driven by Europe, I personally think the reason for this is the continuation of favorable news coming from the Eurozone. A complete retracement of the January move, will take the SPY to the unfilled gap of late December of 2011. A break of and acceptance of that level, will take back the market into bear market, around -20%. Just playing with different scenarios and thinking ahead.
Although the above analysis works well to have an idea of an overall market take, my trading decisions are based on the views below. The market has been continuing to move in the Risk On/Risk Off mode. Most of the assests have been moving in tandem. Although with certain and few exceptions, the negative correlation between risk/US Dollar has been dominating the spectrum. Generally speaking, I haven´t seen many sellers out there, being the levels of longs close to former highs with no sign of diminshing, at least for now.
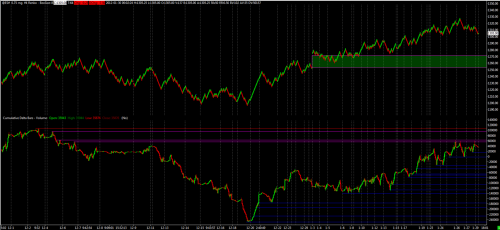
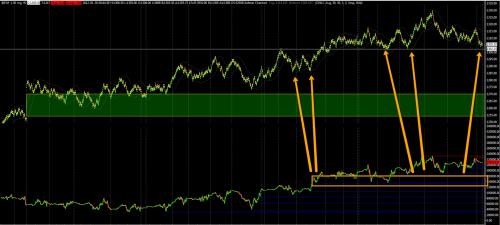
The longer term view, shows that longs are still positioned, reaching levels of the first week of December, 2011 (those marked in pink lines). Those levels tend not to be as reliable as the rest due to the nature of the rollover period. It is also important to note, that those levels are marked by the shorts entered @1250ES and that those shorts have been resisting a 50 pt. move against them. The ES is at what could be an important inflection point. If those shorts decide to cover, it could experience another leg up. Inversely, if those shorts stay committed to their postions and/or add even more to those, the retracement experienced over the last few days, could transform into a bigger correction.
Shorter-term, ES has found support @1303.50 (at the time of writing 12:15AM ET) and there are no shorts above those established last week @1330. The immediate important level of long positions to to be tested are those ones initiated in the 1300 area, which dates back to the last week.
Levelwise, if tonight´s lows do not hold, I see a very thin area below, in the 1303.75-1295.75.
Below that, 1284-1276 as an intermediate support. Above, the 1330-1319 move has been quite sharp. So far, the ES has been gaining acceptance at lower value areas and has been rotating between 1304-1321. I´ll be watching the 1320 level as immediate resistance to be tested. If that area of value is reclaimed, we could possibly see new higs
, provided sustained demand exists.
, provided sustained demand exists.
Take into account that there is plenty of data coming out this week, among others, we will have ISM, ADP, Case-schiller, Eurozone Unemployment, Eurozone Bond Auctions, ISM, Eurozone PMI, consumer confidence, ending the week with NFP. You can see the full calendar of events here, via MarketBeat.
Have a good week.


